
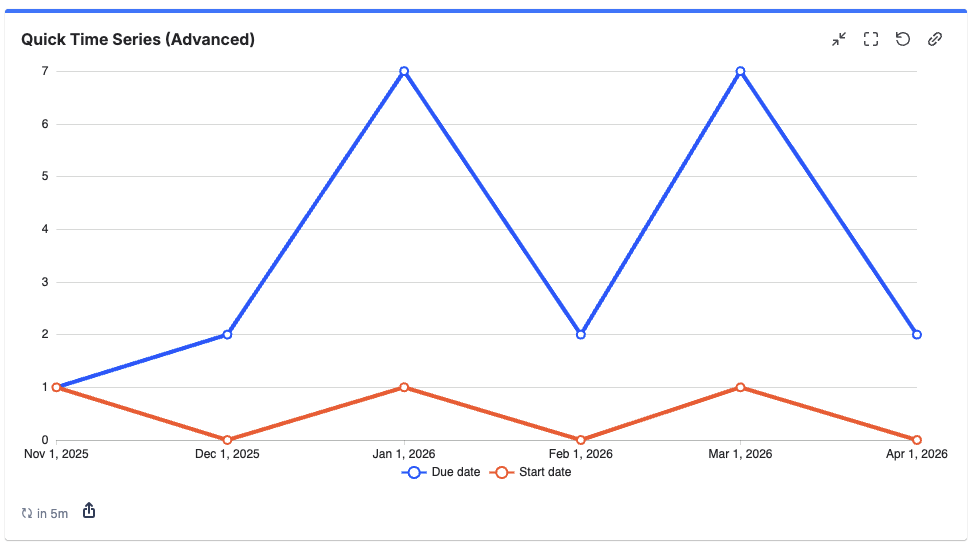
The Quick Time Series gadget displays work item events (like "Due date") over time. This gadget requires the Advanced Edition of Quick Filters for Jira Dashboards.
The gadget can display time series for multiple different date fields in one chart. The gadget also allows you to further split each time series based on field values or custom JQL expressions.
This Quick Gadget can show statistics for up to 10000 work items.
Adding the ‘Quick Time Series’ Gadget to Your Dashboard
-
Go to your Jira Cloud dashboard and click Edit ✏️.
-
Click Add gadget.
-
The Gadget Directory will appear. Locate the Quick Time Series gadget and click the Add button.
-
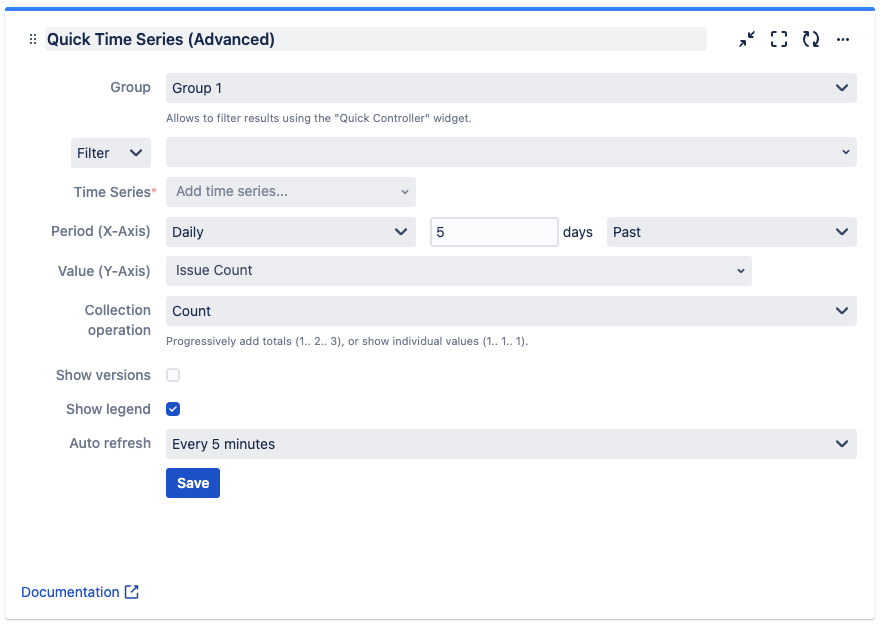
The gadget will appear on your dashboard as follows, ready for you to configure:
-
Group — define the group the gadget will belong to. Only gadgets in the same group are influenced by filters set in a Quick Controller in the same group. (Up to five different groups are possible)
-
Filter results by — refine displayed results by:
-
Filter
-
Space
-
Advanced (JQL)
-
-
Time Series — configure the time series to display:
-
Choose a date field to display in the “Add time series…” dropdown to add a time series.
-
You can add the following time series types:
-
Single time series displays a single line based on all shown work items
-
Field-based time series displays multiple lines, one for each selected value of the selected grouping field.
-
Custom JQL time series displays multiple lines, one for each custom JQL that you configure
-
-
-
Period (X-Axis)— define the length of time for which individual data points are displayed on the x-axis, the amount of periods to display, and if only past, only future, or past and future data is displayed:
-
Hourly
-
Daily
-
Weekly
-
Monthly
-
Quarterly
-
Yearly
-
-
Value (Y-Axis) — define which value is shown. You can select all fields with number values.
-
Collection operation — define if values are displayed individually for time periods or are summed up:
-
Count
-
Cumulative
-
-
Show versions — show versions in the graph.
-
Show legend — display a legend under the graph.
-
Auto refresh — define how often the gadget refreshes. By default every 5 minutes.
-
Every minute
-
Every 5 minutes
-
Every 15 minutes
-
Every 60 minutes
-
Never
-