
The chart visual presents the data as chart. You can choose between these types:
-
Bar Chart
-
Bar Chart (Stacked)
-
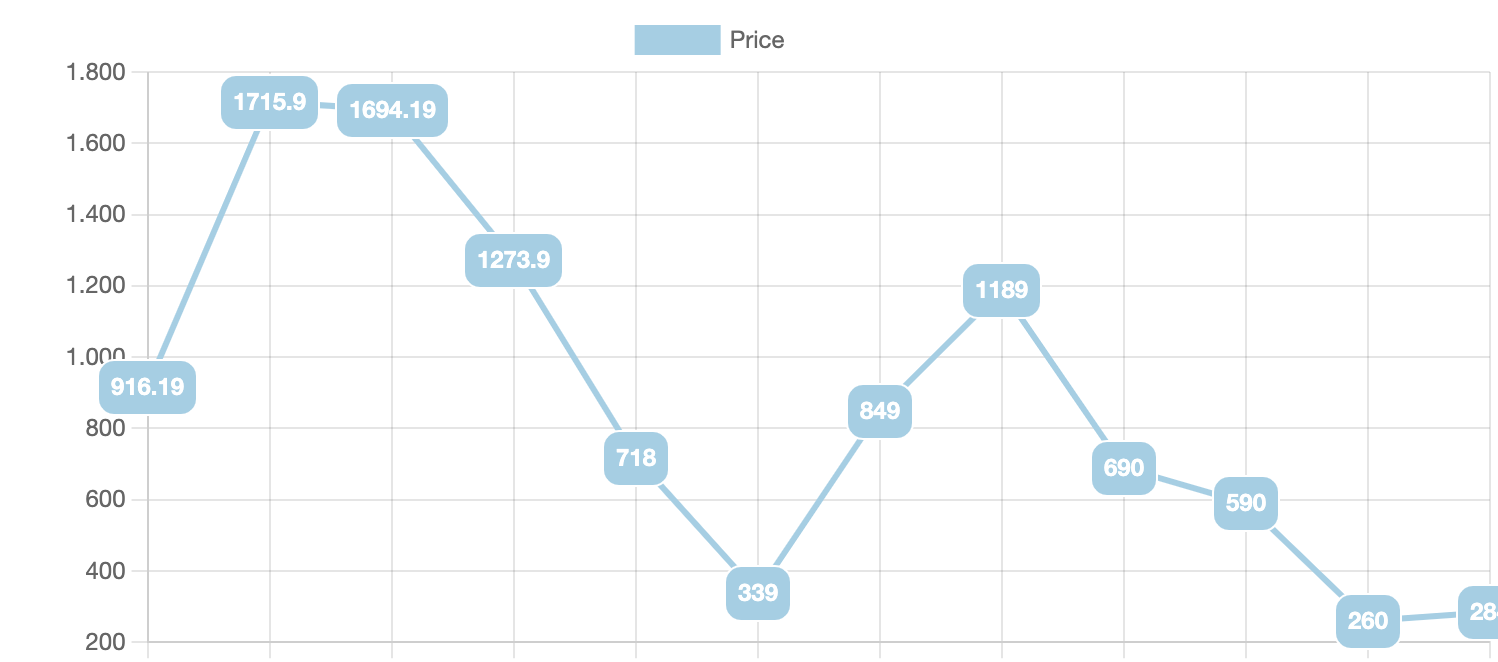
Line Chart
-
Pie Chart
-
Doughnut Pie
-
PolarArea
-
Radar
Labels
The Lables field expects a JSONPath which results in a list of Labels
Data Labels
If activated, the data values are also displayed in the chart without having to specifically move the mouse over the data points.
Datasets
A data set represents a set of values from your data source. Enter a JSONPath expression which results in a list of values to show in the chart.
For an example we use the following data
[{
    "id": 1,
    "name": "Product 1",
    "price": 123,
    "category": "Notebooks"
},
{
    "id": 2,
    "name": "Product 2",
    "price": 345,
    "category": "Tablets"
    }
]
So a configuration for a visual could look similar to this:
Labels: $[*].category
Dataset: $[*].price