External Data for Confluence now supports the "Table Extensibility" feature from Atlassian Confluence, enabling it to function as a data provider.
What is “Table Extensibility”?
Table Extensibility allows elements, such as a data macro, to act as the source of another element. With this feature, you can create complex macros such as pivot tables, visualize macro-sourced data, and link multiple macros to create complex data relationships. This allows you to visualize data in real time, ensuring that any updates will be reflected instantly.
How does External Data for Confluence support this feature?
External Data for Confluence provides built-in support for Table Extensibility in two key visualization types: Table and Chart. When using these visuals, the functionality is automatically enabled. In the case of "Advanced Tables" in the visual template, you can enable this feature by appending the CSS class with "ed-table-data-provider".
By leveraging the power of "Table Extensibility" in External Data for Confluence, you can seamlessly integrate and visualize data from a variety of external sources, enabling you to create dynamic and interactive content within your Confluence pages.
Limitation: Exporting to PDF/Word not supported
Currently, the Confluence exporting functionality to PDF and Word formats is not supported when using the "Table Extensibility" feature with External Data for Confluence. If you need to export your Confluence pages containing tables or charts that utilize this feature, please be aware that the resulting PDF or Word document may not include the dynamically updated data or the visual representations.
Example: Step by Step Guide
Prerequisites: You should already have a Table type panel on a Confluence page.
-
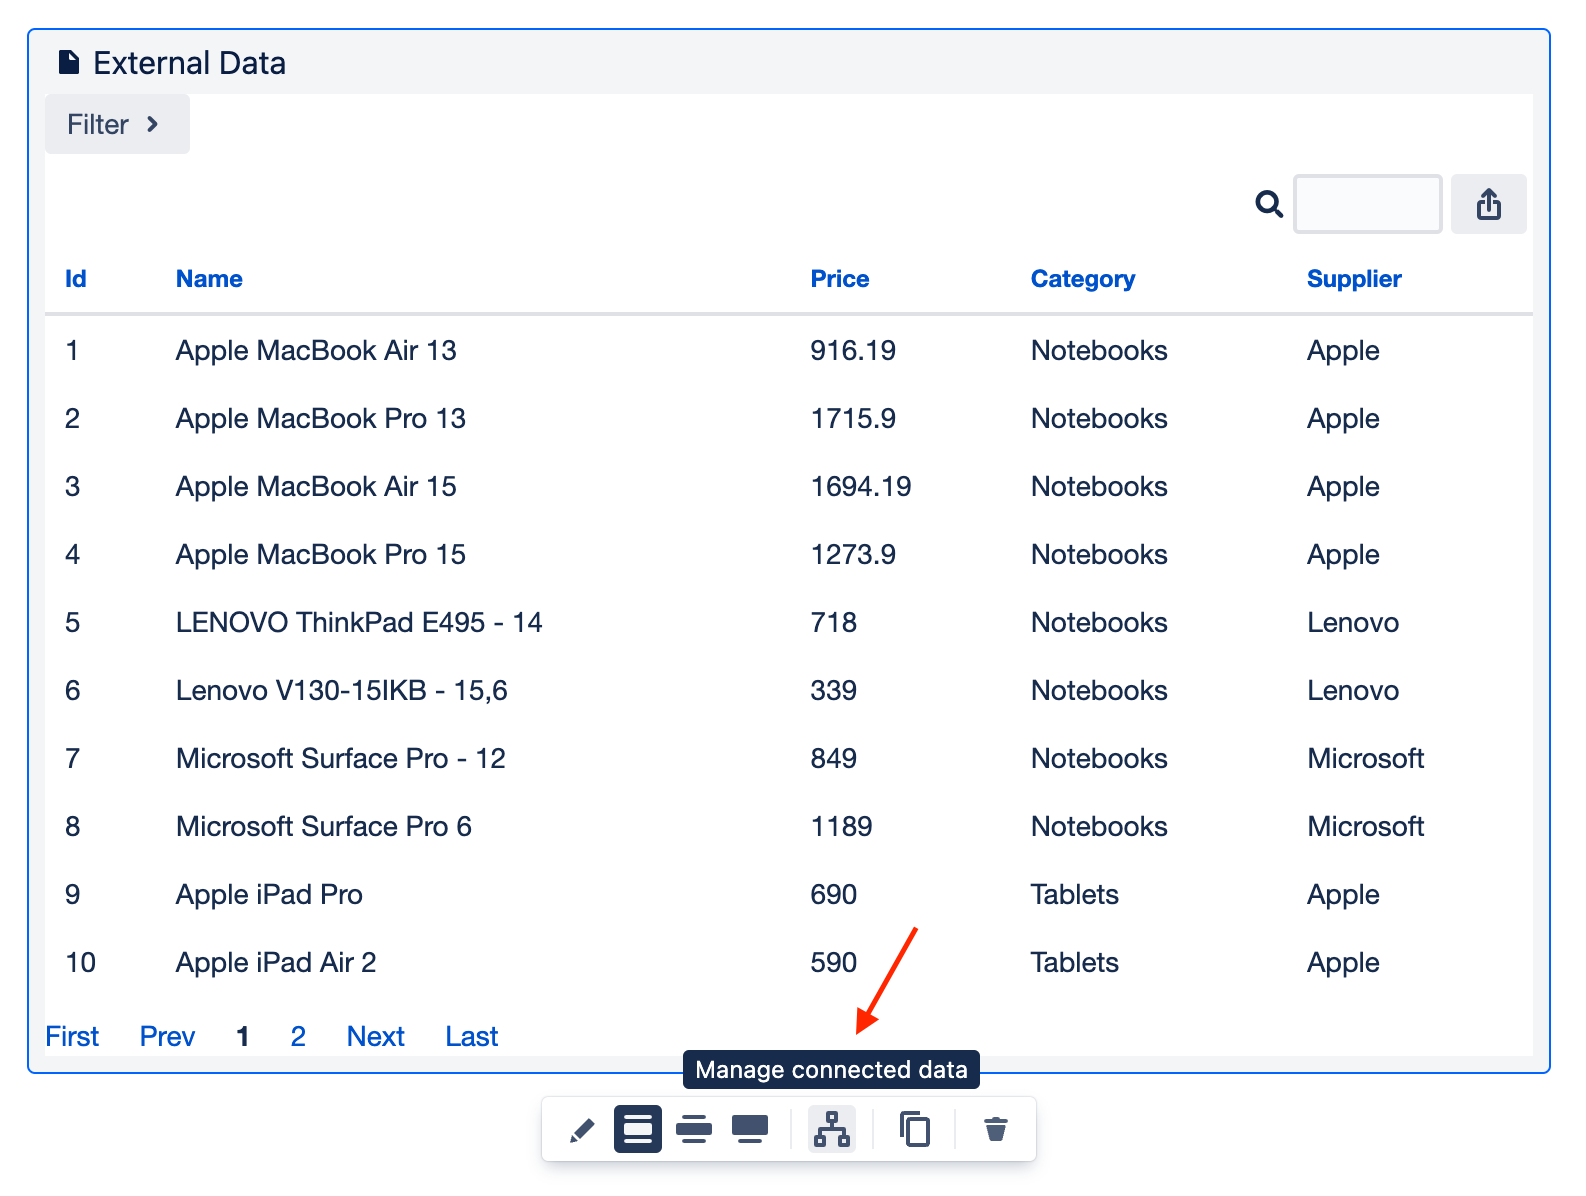
Switch to edit mode on your Confluence page.
-
Click on "Manage connected data". This action opens a sidebar on the right side of the screen where you can add a target.
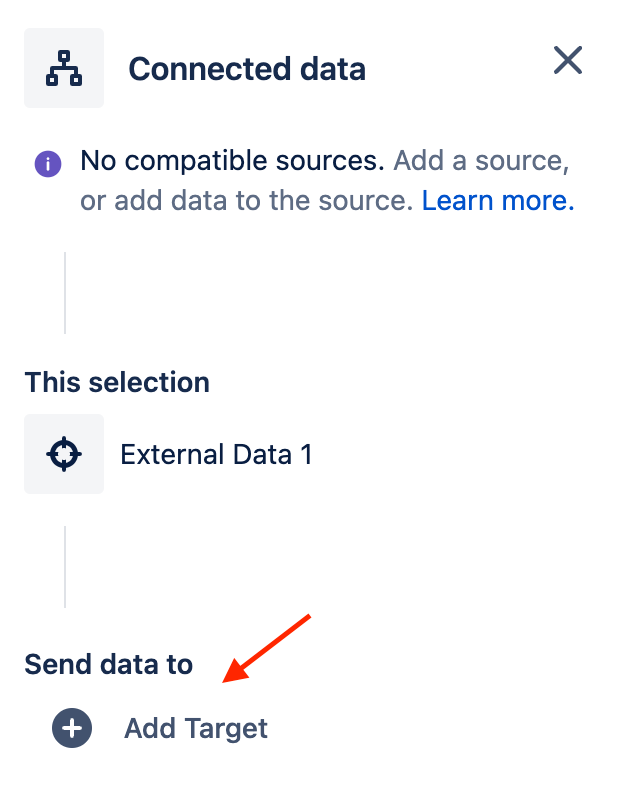
3. Click on “Add Target”
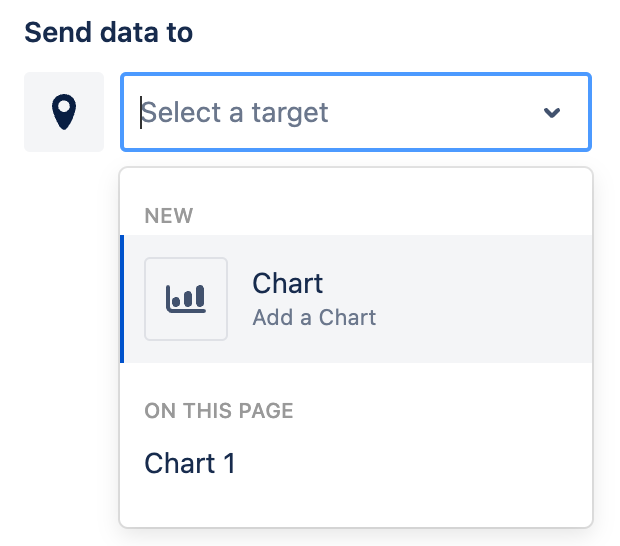
4. Select a target, such as "Chart," which is a native Confluence Chart.
5. Once the chart is created, click on "Chart options". This will open a sidebar on the right:.

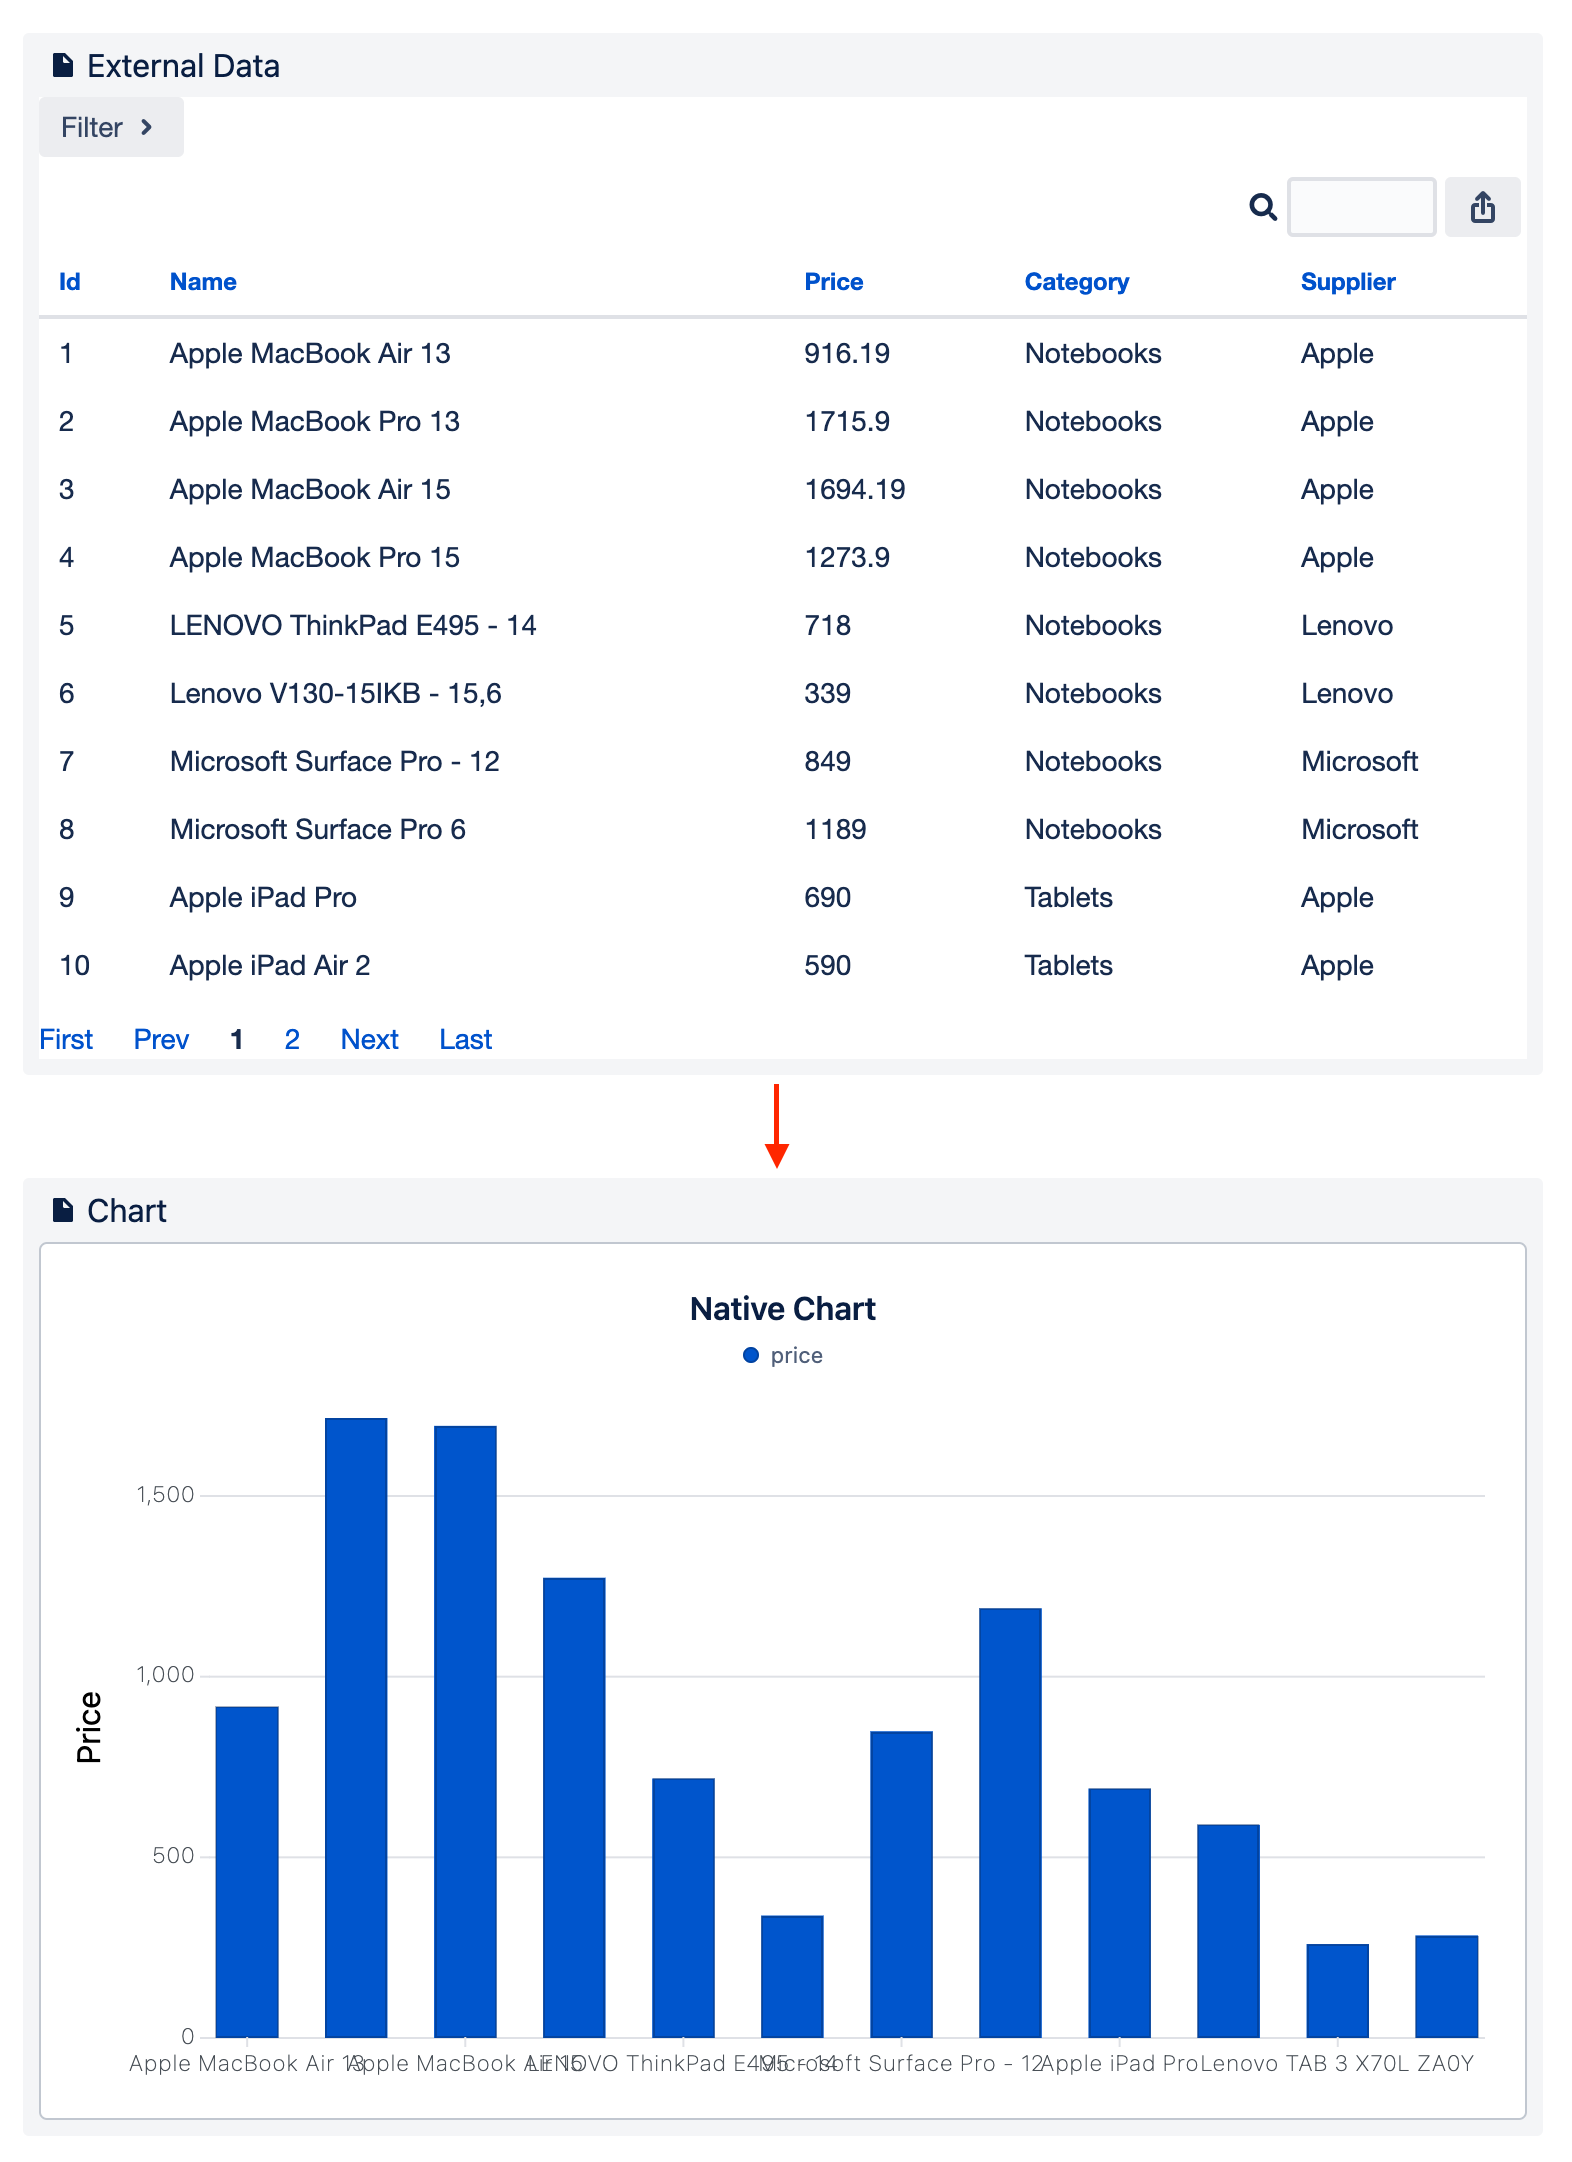
6. Configure the chart by selecting at least one data series.
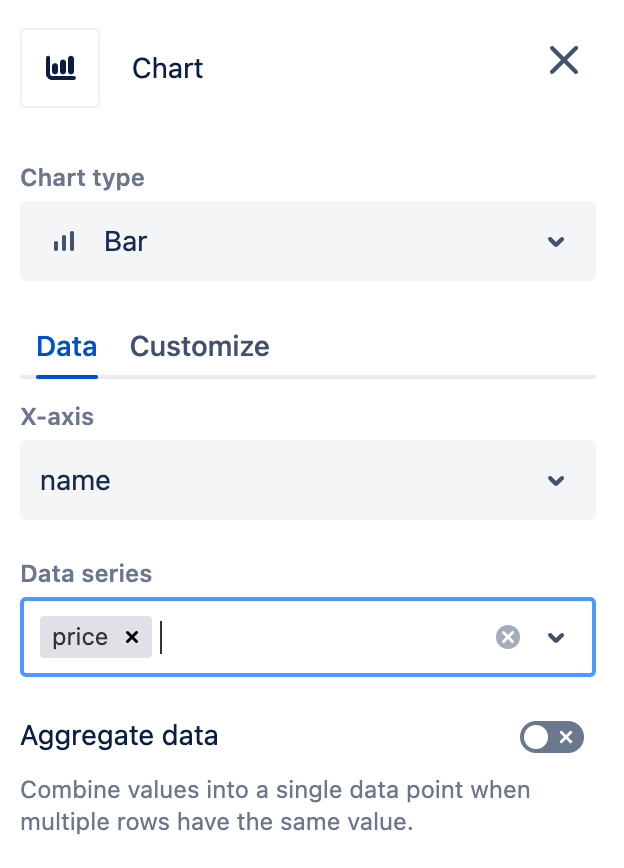
7. The chart is now connected to the table. Any changes in the table are immediately reflected in the chart.