
If your work involves tasks across multiple Jira spaces, you’ve likely experienced the challenge of maintaining a clear overview. While Jira dashboards are a helpful tool for tracking work, managing multiple dashboards or spaces can quickly become overwhelming.
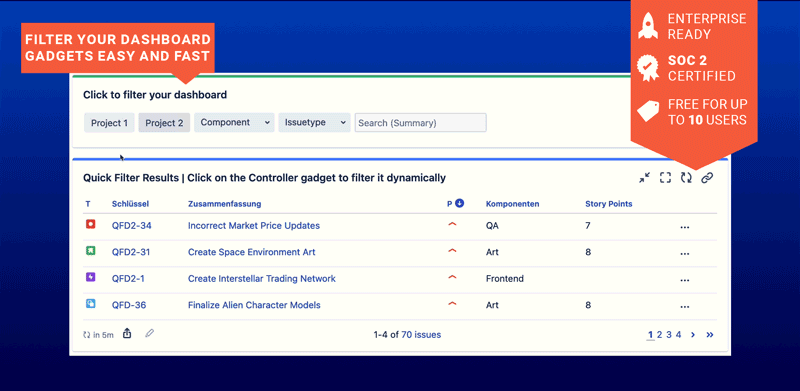
This article will guide you through building a dynamic, interactive dashboard that allows you to track work items across multiple Jira spaces. The solution involves using two key gadgets from the app Quick Filters for Jira Dashboards:
By the end of this setup, you’ll have a basic but flexible dashboard that can be filtered dynamically by Jira spaces.
If you want to view a more advanced cross-space dashboard, check out our demo dashboards.
Why Use a Cross-Space Dashboard?
When managing work across multiple spaces, it’s often necessary to combine data into a single view. A cross-space dashboard enables you to:
-
Focus on specific spaces or teams as needed.
-
View progress across all spaces in one place.
-
Adapt to changes dynamically without needing separate dashboards for every scenario.
This approach is especially useful for team leads, department heads, or anyone involved in work across spaces.
Step-by-Step: Building a Cross-Space Dashboard
1. Add the Gadgets to Your Dashboard
After installing Quick Filters for Jira Dashboards:
-
Open the dashboard where you want to add the functionality and click Edit your dashboard.
-
Search for and add the Quick Filter Results Gadget.
-
Search for and add the Quick Controller Gadget.
2. Configure the Quick Filter Results Gadget
This gadget will display the work items you want to view on your dashboard. It works similar like the native “Filter Results” gadget. To configure it:
-
Open the gadget configuration (this will appear automatically after adding the gadget).
-
Choose a source filter that includes all relevant work items, regardless of their space.
-
If you already have a saved filter for these work items, select it.
-
Alternatively, you can use a JQL query. For example:
Space IN ("Space A", "Space B", "Space C") ORDER BY updated DESC
-
-
Save the configuration.
3. Configure the Quick Controller Gadget
This gadget allows you to dynamically filter the data displayed in the Quick Filter Results Gadget. To set it up:
-
Open the gadget configuration (this will appear automatically after adding the gadget).
-
Under Add Filter, select the field you want to filter by (e.g., “space”).
-
Choose the type of filter you’d like to use, such as a dropdown menu.
-
Save the configuration.
Tip: If you don’t want all spaces from your Jira instance to appear in the dropdown, use a Base JQL to filter for only those relevant to you.
For example:
Space IN ("Space A", "Space B", "Space C")
Testing Your Dashboard
Once the gadgets are configured, test the setup by using the dropdown filter in the Quick Controller Gadget to narrow down the displayed results.
For example:
-
Select a specific space to view only its tasks.
-
Remove the filter to see tasks from all spaces again.
Expanding Your Dashboard
The setup described above is a simple starting point. You can further enhance your dashboard by:
-
Adding additional gadgets, such as:
-
Quick Work Item Statistics Gadget for tracking numerical values like story points or time spent.
-
Quick Bar Chart Gadget to compare data visually (e.g., by components or custom fields).
-
Quick Filter Counts Gadget to display counts or alerts.
-
You can find a complete list of all Quick Gadgets in our documentation. Of course, they can all be dynamically filtered with the Quick Controller gadget.
If you need to track numerical Jira fields like Story Points, Original Estimates, or Time Spent, Quick Filters for Jira Dashboards can automatically sum up these fields for you.
-
Including more filters in the Quick Controller Gadget, such as:
-
Sprints
-
Epics
-
Teams
-
You can use the Quick Controller Gadget to activate multiple filters simultaneously, such as filtering by space and sprint at the same time.
Conclusion
A cross-space dashboard can simplify your work by providing a centralized, dynamic view of all your tasks, regardless of the spaces they belong to. By using the Quick Filters for Jira Dashboards app, you gain the flexibility to filter and adapt your dashboard as your needs evolve.