
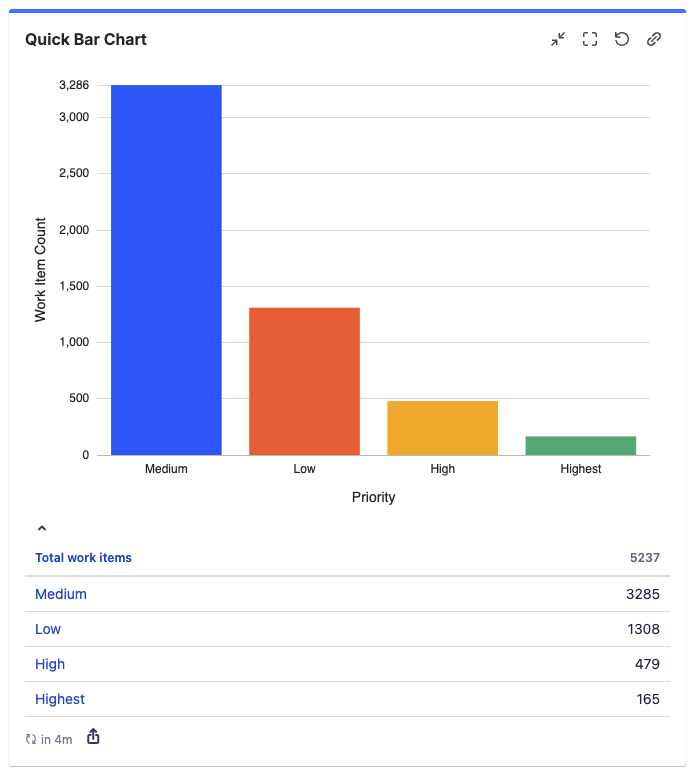
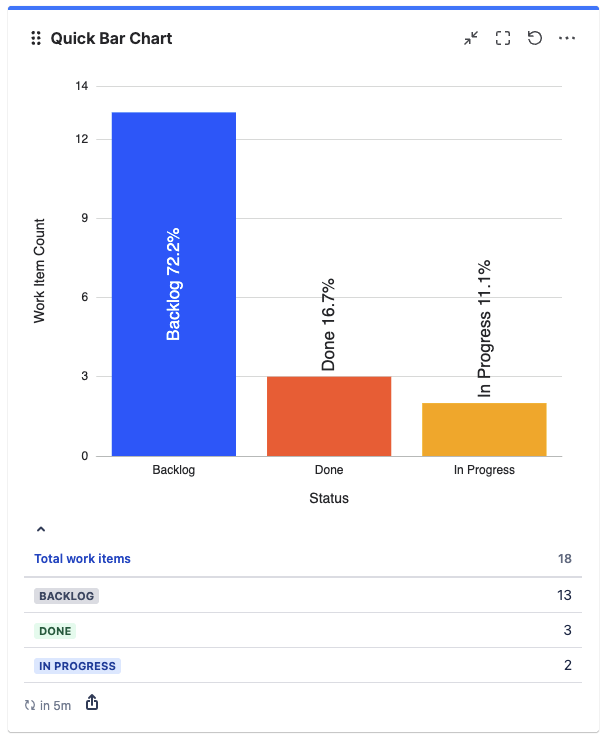
The Quick Bar Chart gadget displays statistical data from a filter grouped by a configurable field – in this example, by work item Priority.
This Quick Gadget can show statistics for up to 5000 work items.
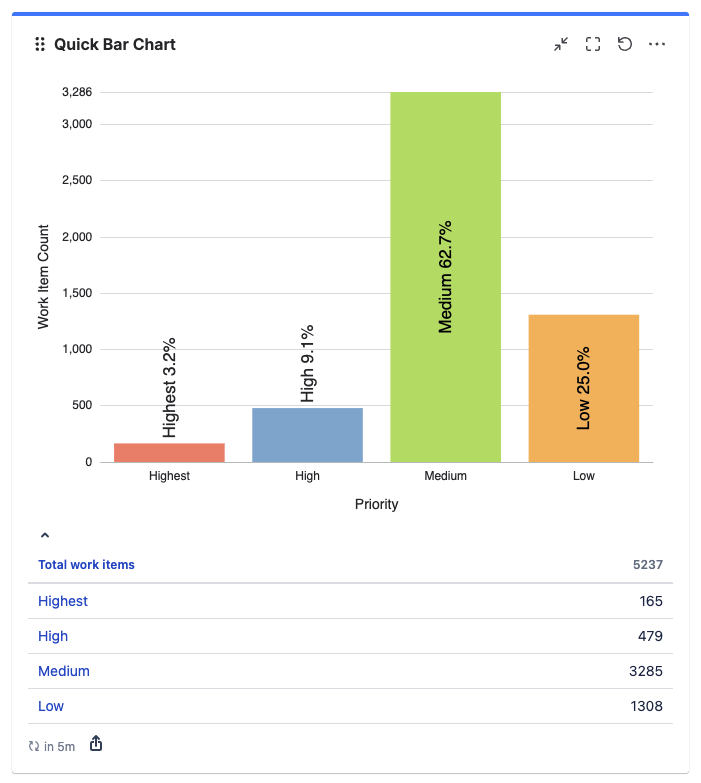
Layout Options
You can customize the layout by using the “Layout options” in the settings of the Quick Bar Chart gadget. Available options include colors, shape of the chart, labels shown, or ordering of values.
Advanced Functionality
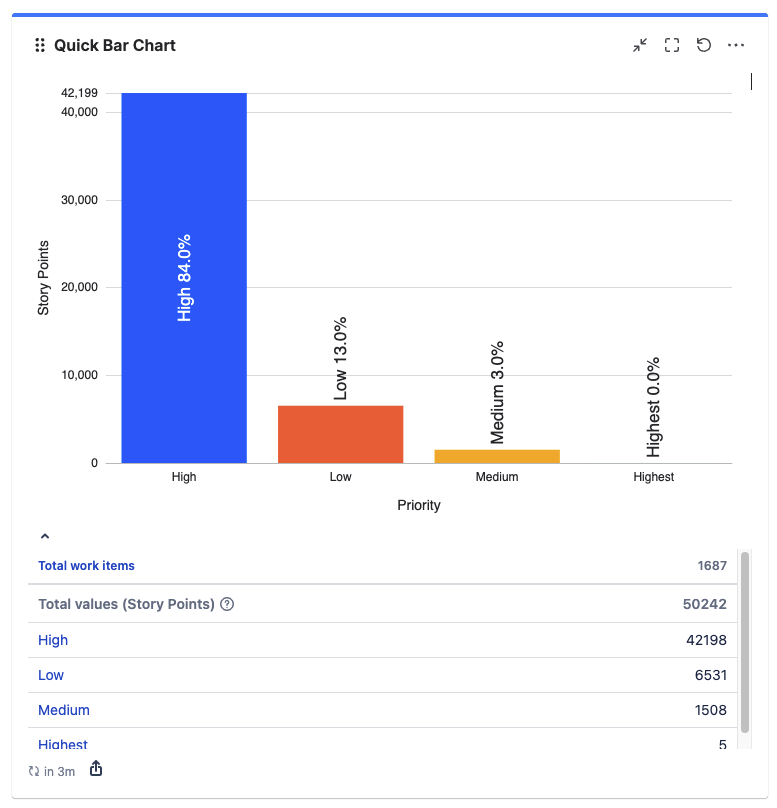
Aggregate Values of Jira Number Fields
Per default, the Quick Bar Chart gadget aggregates the number of work items.
In the gadget settings, you can edit the “Values shown” to any Jira number field or time field (including custom fields). For example, the Quick Bar Chart below shows work items priorities aggregated by story points.
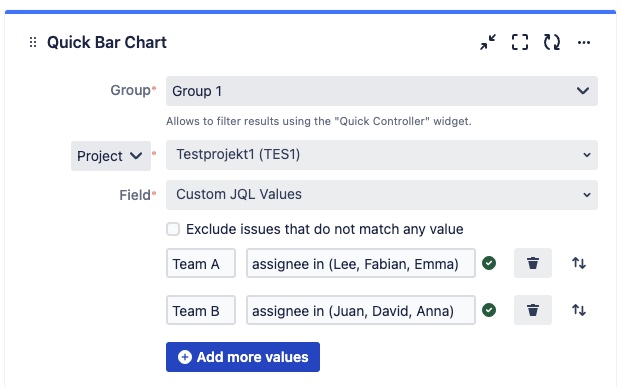
Custom JQL Values
You can utilize Custom JQL Values to form clusters of field values:
Team A assignee in (Lee, Fabian, Emma)
Team B assignee in (Juan, David, Anna)
It is also useful for refining data originating from various sources:
"company name (custom field)" in ("codefortynine", "codefortynine GmbH", "c49")
You can select “Custom JQL Values” in the field dropdown menu to provide up to 10 custom JQLs. The work items are matched against these JQLs and displayed accordingly in the Bar Chart. Please be aware that one work item can match multiple JQLs.
Work items that do not match any of the given JQLs will be grouped as “(None)”. You can deactivate this behavior by toggling the checkbox “Exclude work items that do not match any value”.
If you want to customize the ordering in the Bar Chart just activate the layout option “Sort values by natural field order”. The values will be displayed in the order defined in the gadget configuration.
Match status names with the same name
If you want to create a Bar Chart to display the amount of work items per status from different space types (team-managed and company-managed), the Quick Bar Chart gadget matches statuses with different names.
Adding the 'Quick Bar Chart' Gadget to Your Dashboard
-
Go to your Jira Cloud dashboard and click Edit ✏️.
-
Click Add gadget.
-
The Gadget Directory will appear. Locate the Quick Bar Chart gadget and click the Add button.
-
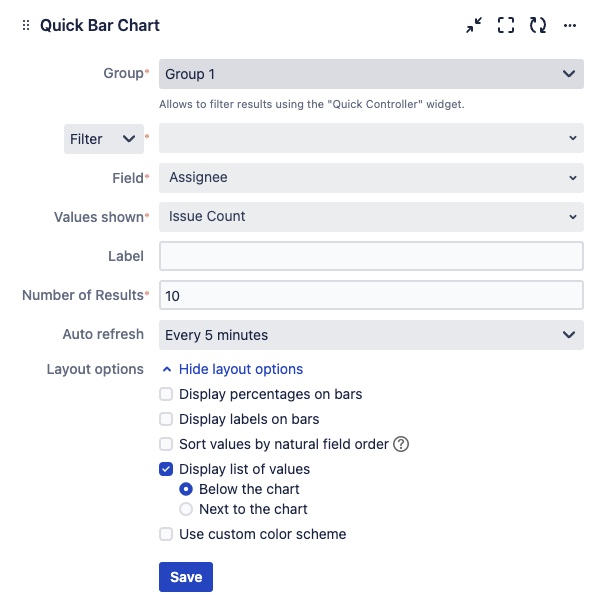
The gadget will appear on your dashboard as follows, ready for you to configure:
-
Group — define the group the gadget will belong to. Only gadgets in the same group are influenced by filters set in a Quick Controller in the same group. (Up to five different groups are possible)
-
Filter results by — refine displayed results by:
-
Filter
-
Space
-
Advanced (JQL)
-
-
Field — define the field for which the statistics/values are displayed
-
Values shown — define which values are shown. You can select all fields with number values.
-
Label — define the label displayed for the bar chart.
-
Number of Results — define the maximum number of shown bars.
-
Auto refresh — define how often the gadget refreshes. By default every 5 minutes.
-
Every minute
-
Every 5 minutes
-
Every 15 minutes
-
Every 60 minutes
-
Never
-
-
Layout options:
-
Display percentages on bars
-
Display labels on bars
-
Sort values by natural field order
-
Display list of values
-
Below the chart
-
Next to the chart
-
-
Use custom color scheme
-