
A task in a sprint can take a few hours to complete, but sometimes also several weeks. Therefore, many development teams use story points to estimate their work. However, Jira's native gadgets only sum up the count of work items, which is often not sufficient for understanding the actual workload of a team or an assignee.
With Quick Filters for Jira Dashboards, you can sum up story points and any other Jira number field, including custom fields. This provides more precise insights into the distribution and progress of work. Additionally, all of these gadgets work together with the Quick Controller gadget, allowing you to dynamically filter down results directly on the dashboard without modifying the underlying filters.
Tip: Try out these gadgets in action! Visit our demo dashboard to see how story points can be summed up and interact with the Quick Controller for dynamic filtering.
The following gadgets support this feature and offer different ways to analyze your data:
The Quick Work Item Statistics and Quick Two-Dimensional Filter Statistics gadgets provide aggregated data, giving you both a high-level overview of the workload (e.g., across multiple sprints) and a more detailed analysis (e.g., per assignee). You can also group data by other Jira fields, as shown in the screenshot below.
By summing up story points instead of work item count, you can track the progress and the velocity of a sprint more effectively.

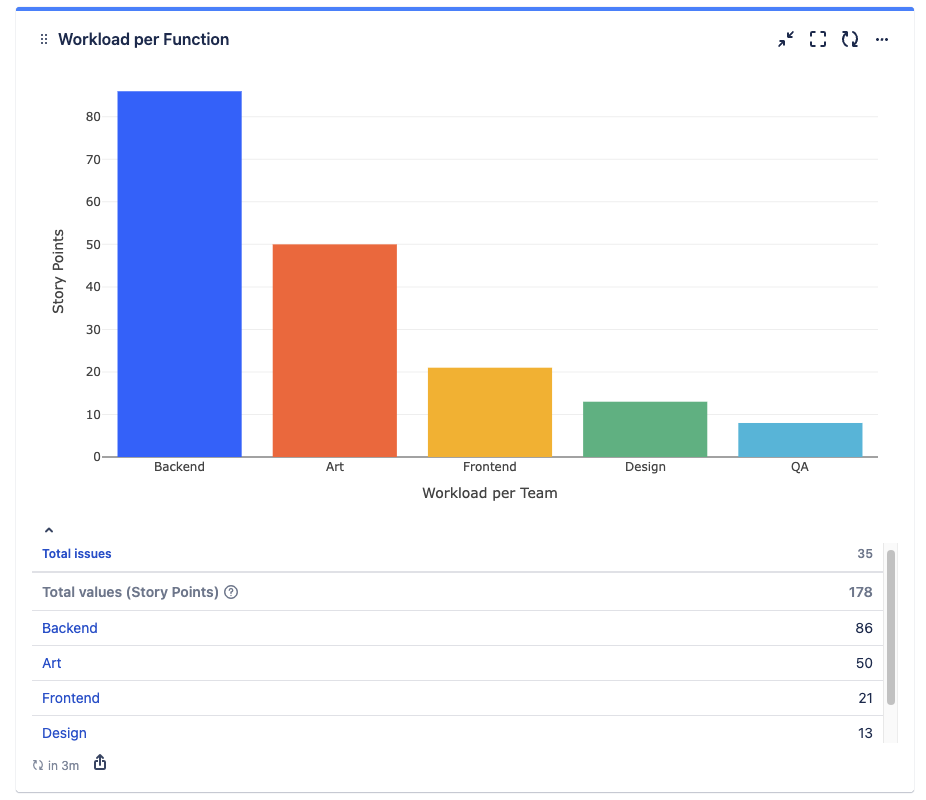
The Quick Pie Chart and Quick Bar Chart offer a structured visual representation of workload distribution. Similar to the statistics gadgets, they help identify where most effort is being allocated to. The clear graphical overview enables teams to quickly assess work priorities and focus areas.
The Quick Created vs Resolved gadget helps track workload and space health over time. By summing up story points, you can assess whether the work being completed keeps up with new tasks being created, providing insights into long-term workload trends.

Conclusion
Summing up story points instead of just work item count makes it much easier to analyze workload and progress effectively. Since this feature works with any Jira number field, you can apply it to many different use cases, such as:
-
Tracking time estimates instead of work item count
-
Summing up business value to prioritize work
-
Monitoring the cost of tasks if financial data is stored in a custom field
-
Calculating the average customer rating on resolved support tickets to assess service quality
By leveraging these gadgets, you can transform raw work item data into actionable insights that support better decision-making and efficient space management.