
Track project progress with the Quick Created vs Resolved Chart in Jira Dashboards for better work item management.
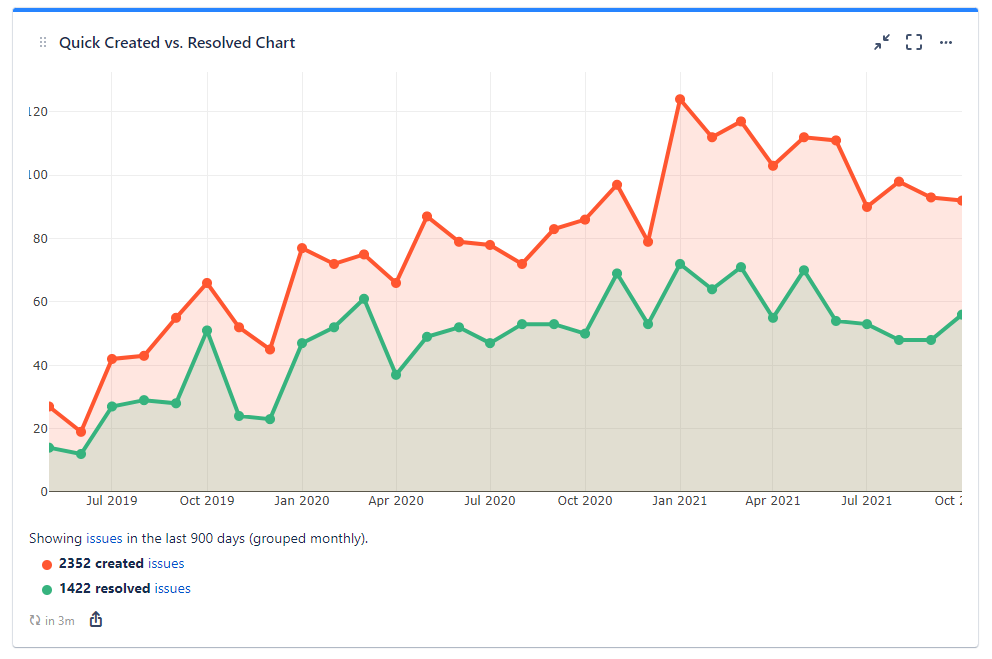
Displays created work items vs. resolved work items for a filter or any other JQL query. Can be combined with the "Quick Controller" gadget.
Adding the 'Quick Created vs. Resolved Chart' Gadget to Your Dashboard
-
Go to your Jira Cloud dashboard and click Edit ✏️.
-
Click Add gadget.
-
The Gadget Directory will appear. Locate the Quick Created vs. Resolved Chart gadget and click the Add button.
-
The gadget will appear on your dashboard as follows, ready for you to configure:
-
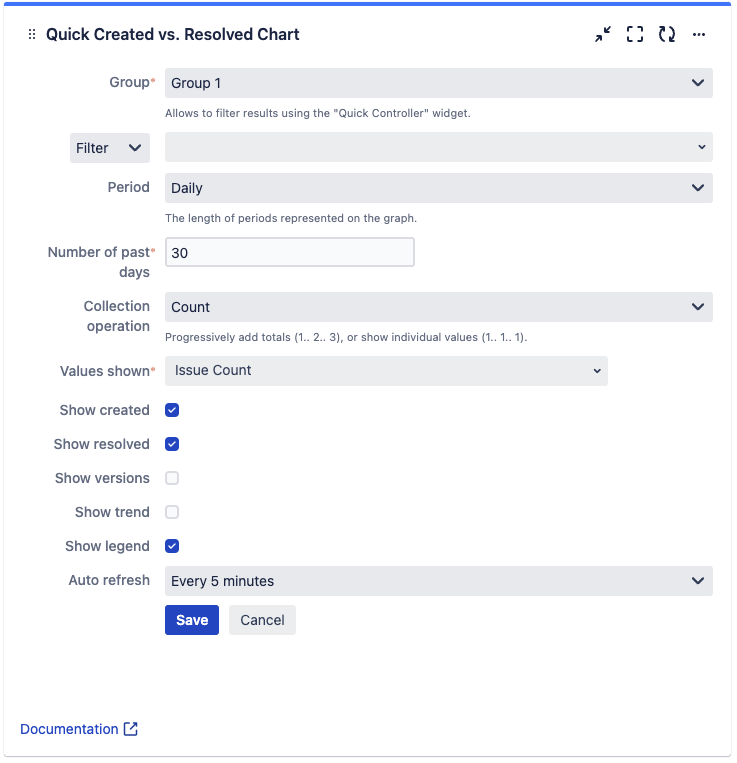
Group — define the group the gadget will belong to. Only gadgets in the same group are influenced by filters set in a Quick Controller in the same group. (Up to five different groups are possible)
-
Filter results by — refine displayed results by:
-
Filter
-
Space
-
Advanced (JQL)
-
-
Period — define the length of time shown for which individual data points are displayed on the x-axis:
-
Hourly
-
Daily
-
Weekly
-
Monthly
-
Quarterly
-
Yearly
-
-
Number of past days/weeks/months/quarters/years — define for how many periods in the past data is displayed on the gadget.
-
Collection operation — define if values are displayed individually for time periods or are summed up:
-
Count
-
Cumulative
-
-
Values shown — define which value is shown. You can select all fields with number values.
-
Show created — show created work items plot in the graph.
-
Show resolved — show resolved work items plot in the graph.
-
Show versions — show versions in the graph.
-
Show trend — display a separate trend line graph.
-
Show legend — display a legend under the graph.
-
Auto refresh — define how often the gadget refreshes. By default every 5 minutes.
-
Every minute
-
Every 5 minutes
-
Every 15 minutes
-
Every 60 minutes
-
Never
-