
Enhance Jira Dashboards with Quick Two-Dimensional Filter Statistics. Display statistical data in a configurable table format.
The Quick Two Dimensional Filter Statistics gadget displays statistical data based on a specified work item filter, in a configurable table format – In this example, the axes are configured to show the number of Work Types per Assignee.
We built this gadget based on the model of Atlassian’s “Two Dimensional Filter Statistics”. You can follow the Atlassian documentation in order to configure the gadget.
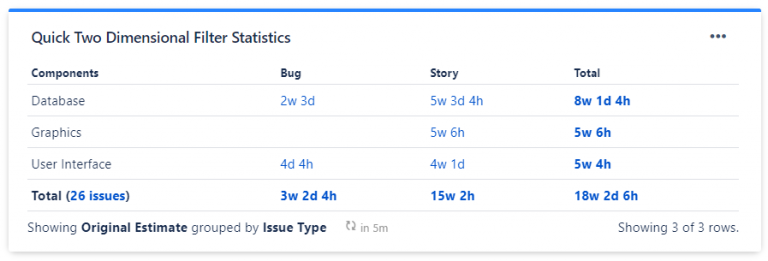
This gadget can show statistics for up to 5000 work items.
Advanced Functionality: Aggregate Values of Jira Number Fields
Aggregate Jira number fields with Quick Filters. Sum, average, and analyze data for comprehensive space insights and efficient management.
The following Quick Gadgets can aggregate Jira number fields:
Per default the gadgets aggregate the number of work items. In the gadget settings you can edit the “Values shown” to any Jira number field (including custom fields), e.g. Story Points. Changing that you can aggregate e.g. the Original Estimate of all work items which are displayed in the gadget.
Additionally, you can choose the function used to aggregate the field values. Available functions are SUM, AVERAGE, MIN and MAX.
Adding the 'Quick Two Dimensional Filter Statistics' Gadget to Your Dashboard
-
Go to your Jira Cloud dashboard and click Edit ✏️.
-
Click Add gadget.
-
The Gadget Directory will appear. Locate the Quick Two Dimensional Filter Statistics gadget and click the Add button.
-
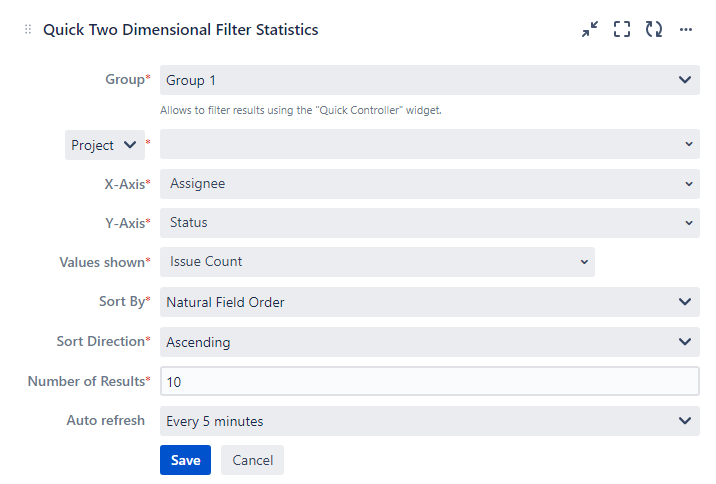
The gadget will appear on your dashboard as follows, ready for you to configure:
-
Group — define the group the gadget will belong to. Only gadgets in the same group are influenced by filters set in a Quick Controller in the same group. (Up to five different groups are possible)
-
Filter results by — refine displayed results by:
-
Filter
-
Space
-
Advanced (JQL)
-
-
X Axis — select a work item field on which the X-axis will be based.
-
Y Axis — select a work item field on which the Y-axis will be based.
-
Values shown — define which values are shown. You can select all fields with number values.
-
Sort By — select how to sort the values of your selected field:
-
Natural Field Order — this will use the field's native sorting order, e.g. for the "Assignee" field, the assignee names would be sorted alphabetically.
-
Row Total — this will sort by the number of work items that match each value, e.g. for the "Assignee" field, the assignee names would be sorted by the number of work items assigned to each person.
-
-
Sort Direction — select whether the field values should be sorted in Ascending or Descending order.
-
Number of Results — type the maximum number of rows that you want the gadget to display per page. (Max. 100)
-
Auto refresh — define how often the gadget refreshes. By default every 5 minutes.
-
Every minute
-
Every 5 minutes
-
Every 15 minutes
-
Every 60 minutes
-
Never
-