Sample Dashboards offer a quick way to explore Quick Filters or see how common gadgets are configured. Only you can access and edit them, making them ideal for testing.
Create a Sample Dashboard
To create your first Sample Dashboard, follow the steps below.
-
Create a new Dashboard or open one you can edit
-
Add a Quick Controller gadget as described in the Getting Started tutorial
-
Click the ‘Create Sample Dashboard’ button in the ‘Getting started’ box at the top of the new gadget
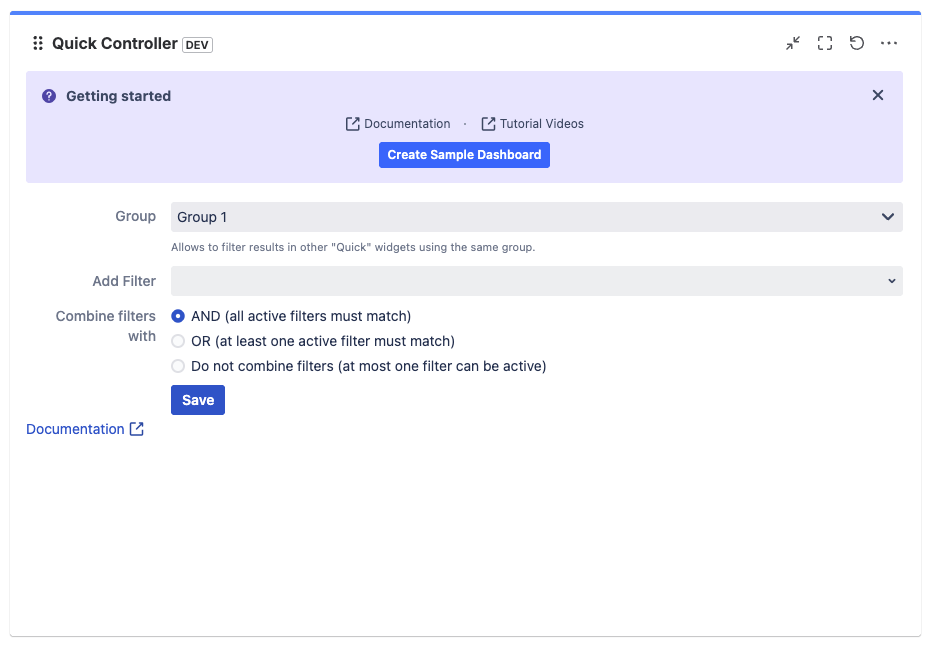
A new dialog lets you configure your Sample Dashboard.
You can also access our documentation and tutorial videos from the “Getting Started” box. It disappears once you save the Quick Controller’s configuration.
Configuring the Sample Dashboard
Configuration is straightforward. Give your new Sample Dashboard a unique name to create it.
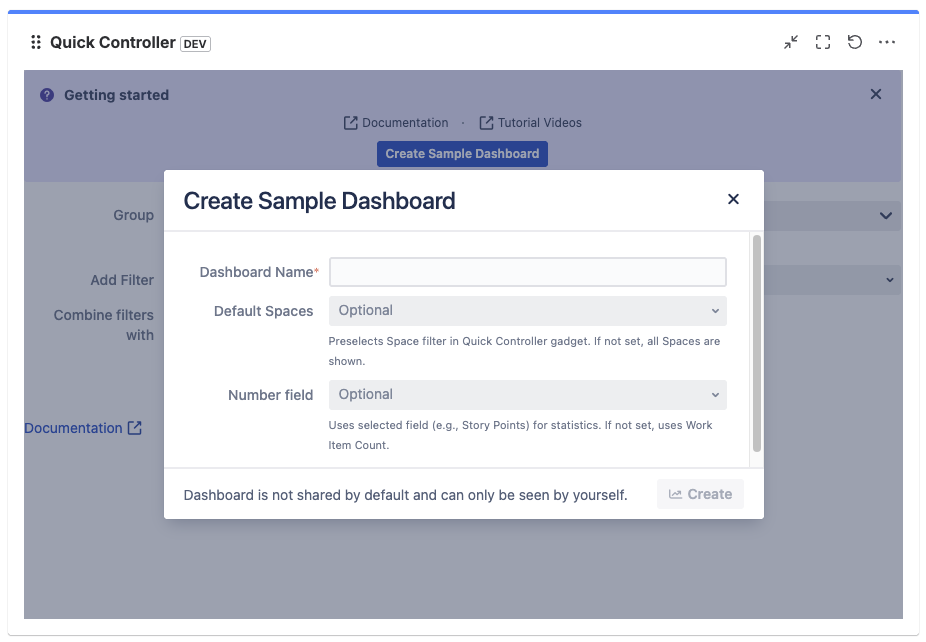
To try Quick Controller’s Default Filter Values, select Spaces to use as defaults on your Sample Dashboard. If you don’t select any Space, no Default Filter will be preselected.
To show advanced statistics, select any Number field, such as ‘Story Point’. The Sample Dashboard will add advanced statistics for that Number field to compatible gadgets like Quick Work Item Statistics.
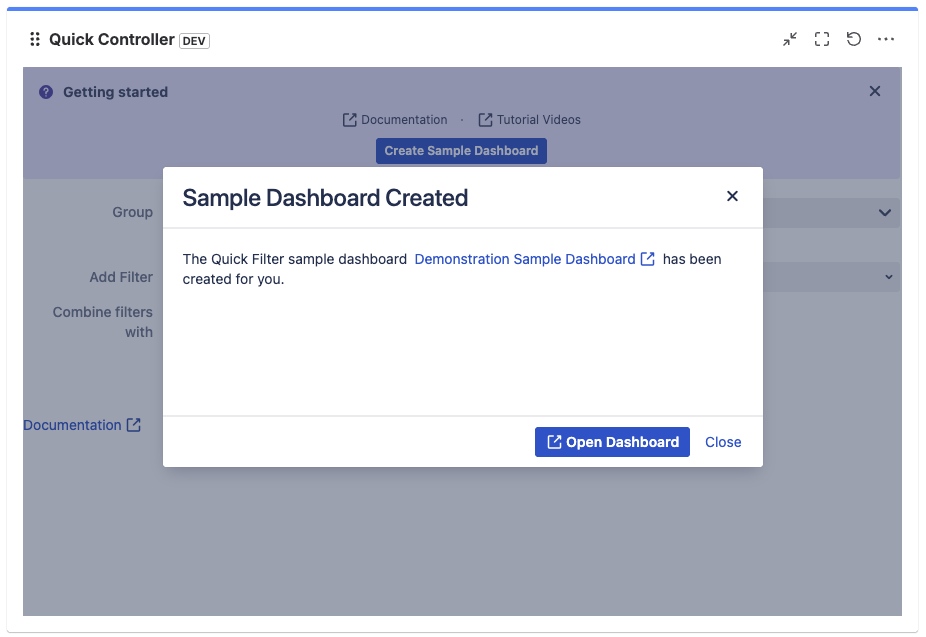
Remember, the new Sample Dashboard is editable and accessible only by you
After creating the Sample Dashboard, click the link or button to open it in a new browser tab.