Demo Dashboards
Since our migration to Atlassian Forge, demo dashboards and their gadgets can no longer be accessed anonymously.
You must be logged in to view dashboard content and results.
Do you already have access to our demo instance? If not, you can invite yourself over this link ↗
We recommend to use the email address of your Atlassian account for this demo.
You can test Quick Filters for Jira Dashboards without installation on our demo dashboards.
Some features and gadgets are not available on our demo dashboards, because they can only be used for spaces that are in active use or if you're logged in as a user.
Demo 1 | Explore some Quick Gadgets
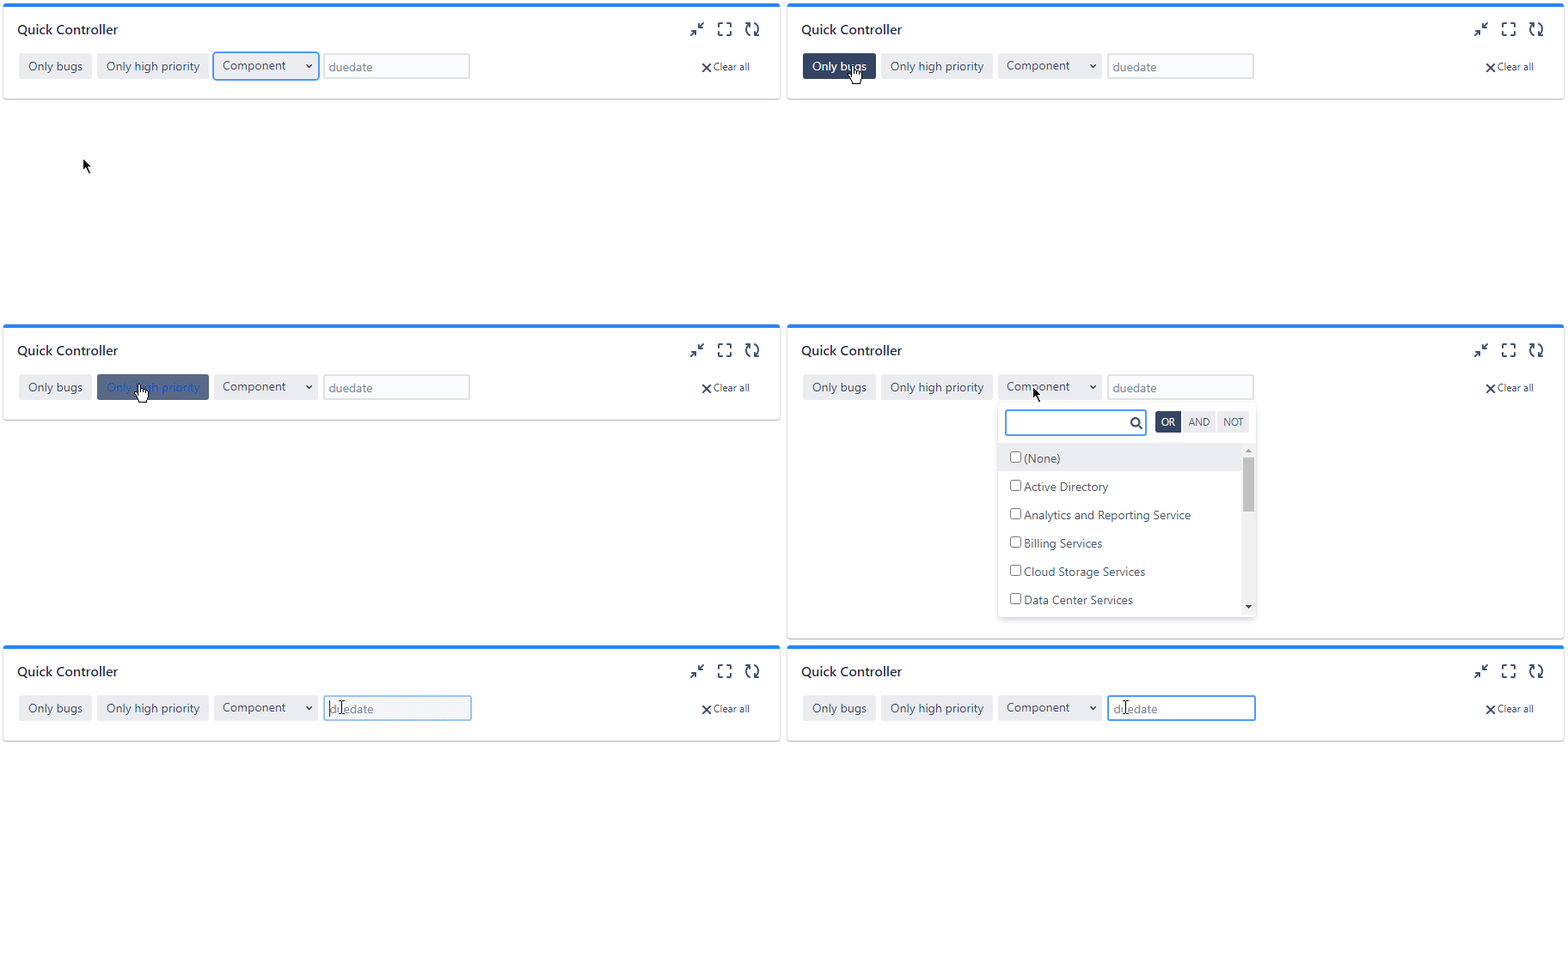
This dashboard shows some of the Quick Gadgets which are part of the Quick Filters app. You can activate the filters on one of the three Quick Controller gadgets to dynamically filter the dashboard.

In the documentation of the Quick Gadgets you can learn more about the advanced features, like summing up story points or any other Jira number field.
Demo 2 | Ways to configure the Quick Controller
On this dashboard the Quick Controller gadgets are configured differently than on the other dashboards:
Filters on the controllers are combined in different ways: Combine Quick Filters with AND, OR, or don't combine them. Read more about combining filters on your Quick Controller.
There are three distinct groups of gadgets that interact with each other. Consequently, one controller communicates with one gadget, while the other controller communicates with another gadget.
Demo 3 | Team Health Dashboard
This dashboard illustrates how to analyze your team's health and performance using Quick Filters for Jira Dashboards.
With the Quick Controller gadget, you can filter all dashboard gadgets by sprint, department, priority, workload, work type, or status.
Alerts to monitor: Set up notifications to stay informed about bottlenecks, upcoming workload, or quality issues early on.
Created vs. Resolved Story Points: Ensure a balance between new and completed story points.
Workload per Function: Identify departments or team members who may need additional support.
Workload per Work Type/Function: Determine which work items are contributing to the workload.
Quick Average Age Chart: Get an overview of the average age of your backlog items and analyze them in more detail using the Quick Controller gadget.
Estimations per Function: Evaluate whether your forecasts are reasonable.
Contact us (Feedback, Feature Requests & Questions)

