
Displays the average time work items spend in selected statuses for a filter or any other JQL query. Can be combined with the Quick Controller gadget.
This Quick Gadget can show statistics for up to 1000 work items.
Work items will be ignored if they have too many entries in their changelog history.
Statuses that have never been associated with a work item will not be displayed.
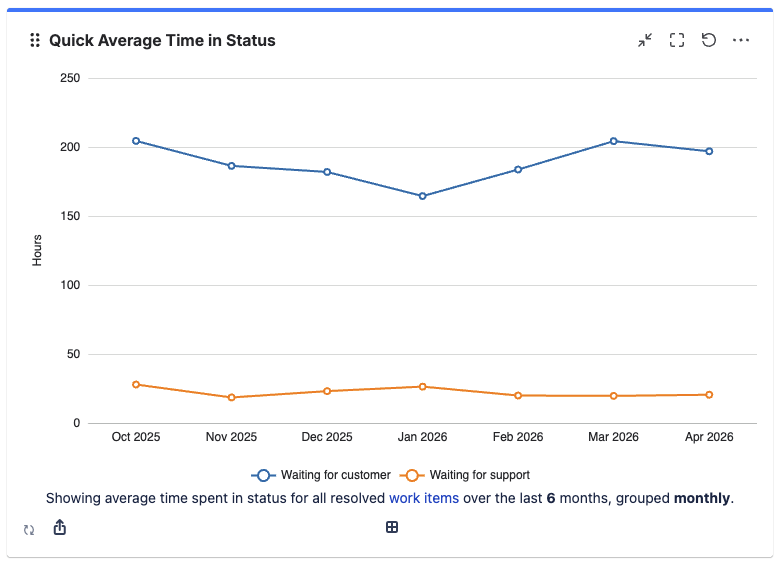
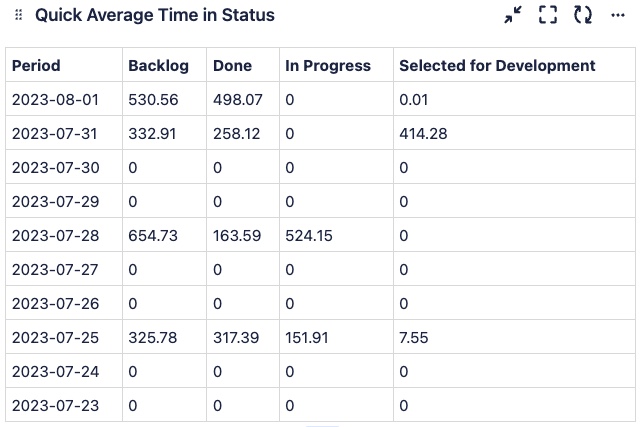
Table View
If you prefer viewing the values in a table format, you can click on the table icon located at the bottom center to switch between the chart and table views.
Adding the 'Quick Average Time in Status' Gadget to Your Dashboard
-
Go to your Jira Cloud dashboard and click Edit ✏️.
-
Click Add gadget.
-
The Gadget Directory will appear. Locate the Quick Average Time in Status gadget and click the Add button.
-
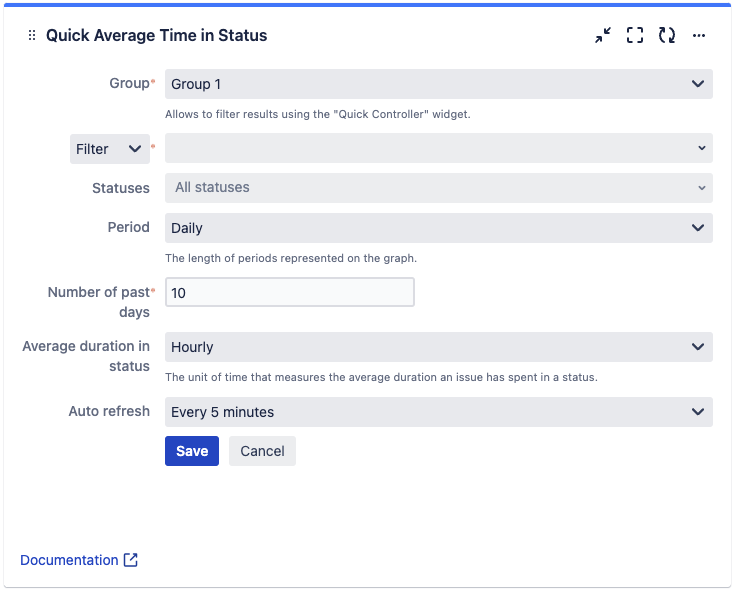
The gadget will appear on your dashboard as follows, ready for you to configure:
-
Group — define the group the gadget will belong to. Only gadgets in the same group are influenced by filters set in a Quick Controller in the same group. (Up to five different groups are possible)
-
Filter results by — refine displayed results by:
-
Filter
-
Space
-
Advanced (JQL)
-
-
Statuses — define the statuses which are displayed in the chart.
-
Period — define the length of time shown for which individual data points are displayed on the x-axis:
-
Hourly
-
Daily
-
Weekly
-
Monthly
-
Quarterly
-
Yearly
-
-
Number of past days/weeks/months/quarters/years — define for how many periods in the past data is displayed on the gadget.
-
Average duration in status — define the unit of time that is used for the y-axis:
-
Hourly
-
Daily
-
-
Auto refresh — define how often the gadget refreshes. By default every 5 minutes.
-
Every minute
-
Every 5 minutes
-
Every 15 minutes
-
Every 60 minutes
-
Never
-