
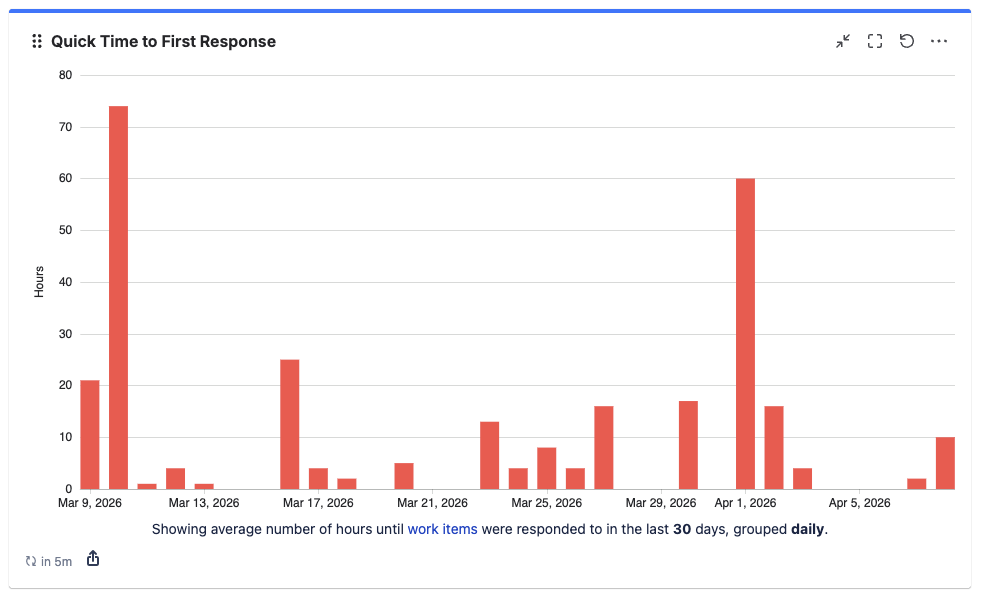
Displays the number of hours taken to respond to work items for a filter or any other JQL query. Can be combined with the "Quick Controller" gadget.
Adding the 'Quick Time to First Response' Gadget to Your Dashboard
-
Go to your Jira Cloud dashboard and click Edit ✏️.
-
Click Add gadget.
-
The Gadget Directory will appear. Locate the Quick Time to First Response gadget and click the Add button.
-
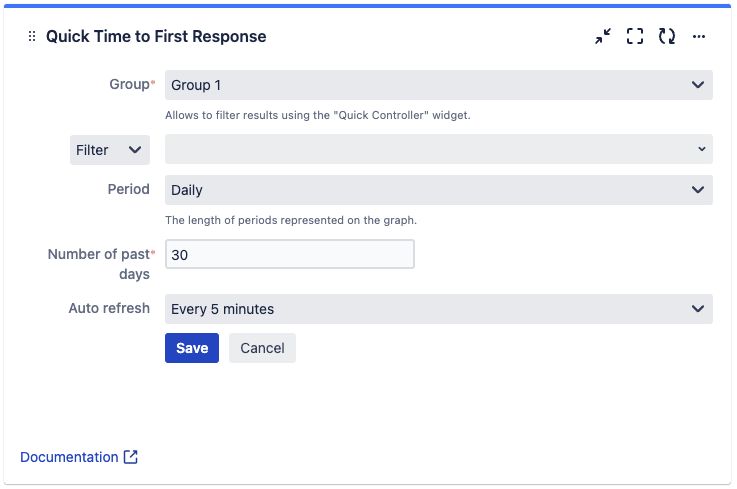
The gadget will appear on your dashboard as follows, ready for you to configure:
-
Group — define the group the gadget will belong to. Only gadgets in the same group are influenced by filters set in a Quick Controller in the same group. (Up to five different groups are possible)
-
Filter results by — refine displayed results by:
-
Filter
-
Space
-
Advanced (JQL)
-
-
Period — select the timeframe on which the chart will be based:
-
Hourly
-
Daily
-
Weekly
-
Quarterly
-
Yearly
-
-
Number of past days/weeks/months/quarters/years — define for how many periods in the past data is displayed on the gadget.
-
Auto refresh — define how often the gadget refreshes. By default every 5 minutes.
-
Every minute
-
Every 5 minutes
-
Every 15 minutes
-
Every 60 minutes
-
Never
-